
Episode 48
In part one of the automation series, we explored the adoption of electronic automation, and in part two, we explored the best management practices around the development and maintenance of electronic automation systems. This blog will take a common business process, business reporting, and explore how automation is radically changing the business intelligence profession.
Without reporting an organization is blind. You cannot manage what you do not measure, and it is very clear to business leaders that the data that the organization generates holds powerful insights. From insights comes Business Intelligence, and with it we have the foundation for both strategic and tactical decision making. Typically, business reporting is a task performed by analysts and middle management. I have had the pleasure to have worked with numerous individuals that took immense pride in their spreadsheet-foo to aggregate and analyze financial and operational data. What is changing is that the spreadsheet-foo is being replaced with applications that largely automate most of the workflows. Reporting software is nothing new, but in the past, due to resource requirements, only large, sophisticated enterprises could justify the expense.

To understand how the business intelligence landscape is changing, it is important to cover the core processes, extract – transform – load (ETL), that are involved with converting unstructured data into useful information. The process starts with data in a raw form which could be sales, operations, social media metrics, data exports from enterprise applications, data from SaaS applications, or IoT data housed in various forms and locations. The first step is to extract this data from each of their respective sources. The data in its current form will require cleaning and structuring. Assigning/transforming data formats (I’m looking at you dates and times), removing unnecessary columns, filtering unnecessary values, merging and appending tables, creating calculated/conditional columns, extracting values, and much more. Careful consideration of the data structure at the source and its relationship with the transformation stage of the ETL process can have a dramatic impact on performance, development requirements, and ease of maintenance (a topic for a future blog). Lastly the transformed data must be loaded into a space for analysis.
To this day, there are individuals copying CSVs, merging data from other spreadsheets, and VLOOKUP-ing their way to a final report. It is not uncommon for individuals to spend a few weeks every quarter preparing such reports manually. However, with these systems it is very challenging to ensure that sensitive data is only available to those with the proper permissions. Additionally, for the organization to be agile, the time between data generation and conversion to insight should be as close to real time as possible. Waiting several weeks to make a correction could be a significant lost opportunity.
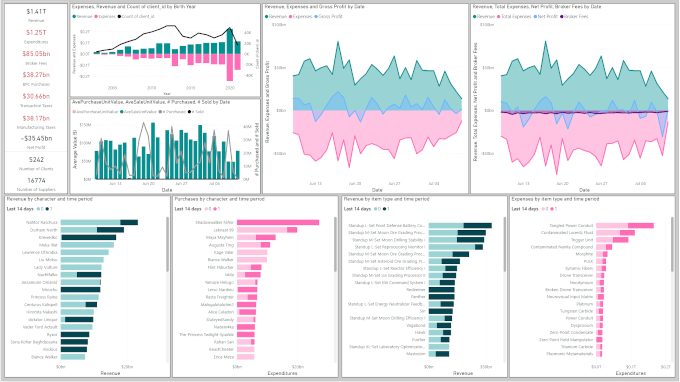
There are numerous tools that can completely remove the tedium of manual report building. Amazon Redshift, Google BigQuery, and Azure Data Factory are powerful ETL and data warehouse management platforms. Typically, these tools are for professional developers and data engineers. The critical shift is the democratization of data analytics to more users through applications like Power BI. In the past, I faced a roadblock where I did not know how to parse JSON files. Then I discovered the Power Query engine in Excel; as a non-developer, my ability to work with data grew exponentially. It was a magical moment. The mixture of UI development paired with access to the application code is a gateway for Power Users to move into more sophisticated development techniques. A current trend is the increasing demand for individuals with strong business backgrounds coupled with the knowledge to develop reports with applications like Power BI. A natural evolution from analysts using spreadsheets.
With applications like Power BI, weeks of work can be replaced with a single button click (and even that button click can be automated). If we recall from the first blog in the series, human energy is replaced with computation; the ETL engine frees up the report writer to spend more resources connecting to more data sets and performing deeper analysis. Likewise, the analysis intensity is increasing with visualization app spaces, AI inference and insights, and the ability to ask questions from the data. The shift from human inputs to computation is dramatically scaling the insight productivity of the individual, and leading organizational insight driven agility.
Last Updated: June 25, 2025